AWS-Day9-Assignment
(CloudWatch, SNS, AWS CloudTrial, AWS VPC Flowlog)
1. What is Cloudwatch? What are the types of monitoring in Cloudwatch? How is pricing different for Detailed Monitoring?
Ans:
Amazon CloudWatch is a monitoring and observability service provided by Amazon Web Services (AWS). It allows you to collect and track various metrics, collect and monitor log files, and set up alarms and notifications based on the data collected. CloudWatch helps you gain insights into the performance, availability, and operational health of your AWS resources and applications.
There are primarily two types of monitoring in Amazon CloudWatch:
Basic Monitoring: Basic Monitoring is the default level of monitoring provided by CloudWatch at no additional cost. It includes a set of predefined metrics that AWS services automatically send to CloudWatch. These metrics typically have a 5-minute granularity, which means that CloudWatch collects data points every 5 minutes. Basic Monitoring is suitable for most use cases and helps you get started with monitoring your AWS resources.
Detailed Monitoring: Detailed Monitoring is an enhanced level of monitoring that provides more frequent data points for AWS resources. It typically collects data points every 1 minute, offering higher-resolution data for more accurate insights into resource performance. However, Detailed Monitoring comes at an additional cost, which varies depending on the AWS resource being monitored.
Regarding the pricing for Detailed Monitoring, AWS charges additional fees for each resource that you enable Detailed Monitoring on. The cost varies depending on the resource type. Detailed Monitoring pricing is typically listed on the AWS Pricing page, which you can refer to for the most up-to-date information.
To enable Detailed Monitoring for a specific AWS resource, you can usually do so through the AWS Management Console, AWS Command Line Interface (CLI), or AWS SDKs. Keep in mind that enabling Detailed Monitoring will result in higher monitoring costs, so it's important to assess whether the higher granularity of data is necessary for your specific use case.
For detailed and accurate pricing information, it's always a good practice to check the AWS Pricing page or consult with AWS support to understand the current pricing structure for the specific AWS resources you plan to monitor with Detailed Monitoring in Amazon CloudWatch. AWS often updates its pricing, so it's important to stay informed about any changes that may affect your monitoring costs.
2. What are the cloudwatch metrics that are available for EC2 instances, EBS Volumes, and Load Balancers?
Ans:
Amazon CloudWatch provides a variety of metrics for monitoring EC2 instances, EBS volumes, and Elastic Load Balancers (ELBs). Here are some of the key metrics available for each of these AWS resources:
For EC2 Instances:
CPU Utilization: Monitors the CPU usage of the EC2 instance, allowing you to track how much computational capacity is being used.
Network In/Out: Measures the rate of incoming and outgoing network traffic to and from the instance, helping you understand network activity.
Disk Read/Write Operations: Tracks the number of read and write operations on instance storage or EBS volumes attached to the instance.
Status Check Failures: Indicates the number of times the instance has failed one or both status checks (system status and instance status).
Memory Utilization (if enabled): Monitors memory usage if you have enabled detailed monitoring for the instance.
Disk Space Utilization (if enabled): Monitors the usage of the instance's root file system or additional volumes if detailed monitoring is enabled.
For EBS Volumes:
VolumeReadBytes/VolumeWriteBytes: Measures the number of bytes read from and written to the EBS volume, helping you understand data transfer rates.
VolumeReadOps/VolumeWriteOps: Tracks the number of read and write operations to the EBS volume, which is useful for monitoring I/O activity.
VolumeQueueLength: Indicates the number of read and write operation requests that are waiting in the volume's queue, helping you identify potential performance bottlenecks.
For Elastic Load Balancers (ELBs):
RequestCount: Monitors the total number of requests handled by the load balancer, which is crucial for understanding traffic patterns.
HealthyHostCount/UnHealthyHostCount: Tracks the number of healthy and unhealthy instances behind the load balancer, helping you assess the health of your application.
Latency: Measures the time it takes for a request to be processed by the load balancer, which is important for assessing application responsiveness.
HTTPCode_ELB_4XX/HTTPCode_ELB_5XX: Provides counts of HTTP 4xx and 5xx status codes returned by the load balancer, which can help you identify client and server errors.
TargetResponseTime: Indicates the time taken by the backend instances to respond to requests, giving insights into application performance.
TargetConnectionErrors/TargetTimeoutCount: Monitors errors and timeouts in the connections between the load balancer and backend instances.
These are just a selection of the metrics available for EC2 instances, EBS volumes, and ELBs. You can access these metrics through the Amazon CloudWatch console or programmatically using the AWS CLI or SDKs. Additionally, you can create custom CloudWatch alarms and dashboards to set up automated monitoring and alerts based on these metrics to ensure the health and performance of your AWS resources.
3. What are Custom metrics in Cloudwatch? Set up Memory Metric for EC2 and push it to Cloudwatch.
Ans:
Custom metrics in Amazon CloudWatch are user-defined metrics that you can create and publish to CloudWatch for monitoring and analyzing specific data from your applications, workloads, or resources. Unlike the predefined AWS metrics that CloudWatch automatically collects from various AWS services, custom metrics allow you to collect and track data that is unique to your applications or infrastructure. Custom metrics provide a way to gain deeper insights into the performance, behavior, and health of your systems.


4. What are Cloudwatch Log Groups and Log Insights?
Ans:
Amazon CloudWatch Log Groups and CloudWatch Log Insights are services provided by AWS for managing and analyzing log data generated by various AWS resources, applications, and services. Let's take a closer look at each of these components:
CloudWatch Log Groups:
A CloudWatch Log Group is a logical container for log data in CloudWatch Logs. Log data can be generated by AWS resources like EC2 instances, Lambda functions, RDS databases, or custom applications and services running on AWS or on-premises. Log Groups help you organize and store log data efficiently. Here are key points about CloudWatch Log Groups:
Organization: Log Groups allow you to organize log data by grouping related log streams together. This is helpful when you have multiple sources of log data, and you want to categorize and manage them.
Retention: You can set a retention policy for Log Groups to specify how long log data should be retained. You can choose to retain logs indefinitely or for a specific number of days.
Access Control: Log Groups can have their own access control policies, allowing you to control who can access and interact with the log data within a group.
Log Streams: Within a Log Group, log data is further divided into Log Streams. Each Log Stream represents a source of log data, such as an individual EC2 instance or Lambda function. Log Streams make it easier to track and analyze data from specific sources.
CloudWatch Log Insights:
CloudWatch Log Insights is a service that enables you to interactively search and analyze log data from CloudWatch Logs. It provides a powerful and flexible querying language that allows you to extract meaningful information from your log data. Here are the key features of CloudWatch Log Insights:
Real-time Analysis: Log Insights enables real-time analysis of log data, so you can quickly troubleshoot issues or monitor system behavior as it happens.
Query Language: It offers a query language with functions and operators that allow you to filter and aggregate log events. You can use this language to create complex queries to extract specific information.
Visualizations: Log Insights can visualize query results as tables or time series charts, making it easier to understand log data trends and patterns.
Interactive Exploration: You can interactively explore log data, refine queries, and pivot on specific data points to gain insights into issues or performance bottlenecks.
Integration with Logs: Log Insights integrates seamlessly with CloudWatch Logs, allowing you to run queries against specific Log Groups and Log Streams.
Log Insights is particularly useful for diagnosing issues, monitoring application performance, and gaining operational insights from log data. It simplifies the process of sifting through large volumes of logs and helps you find relevant information quickly.
Together, CloudWatch Log Groups and CloudWatch Log Insights provide a comprehensive solution for managing, storing, and analyzing log data in AWS, making it easier to maintain the health and reliability of your applications and resources.
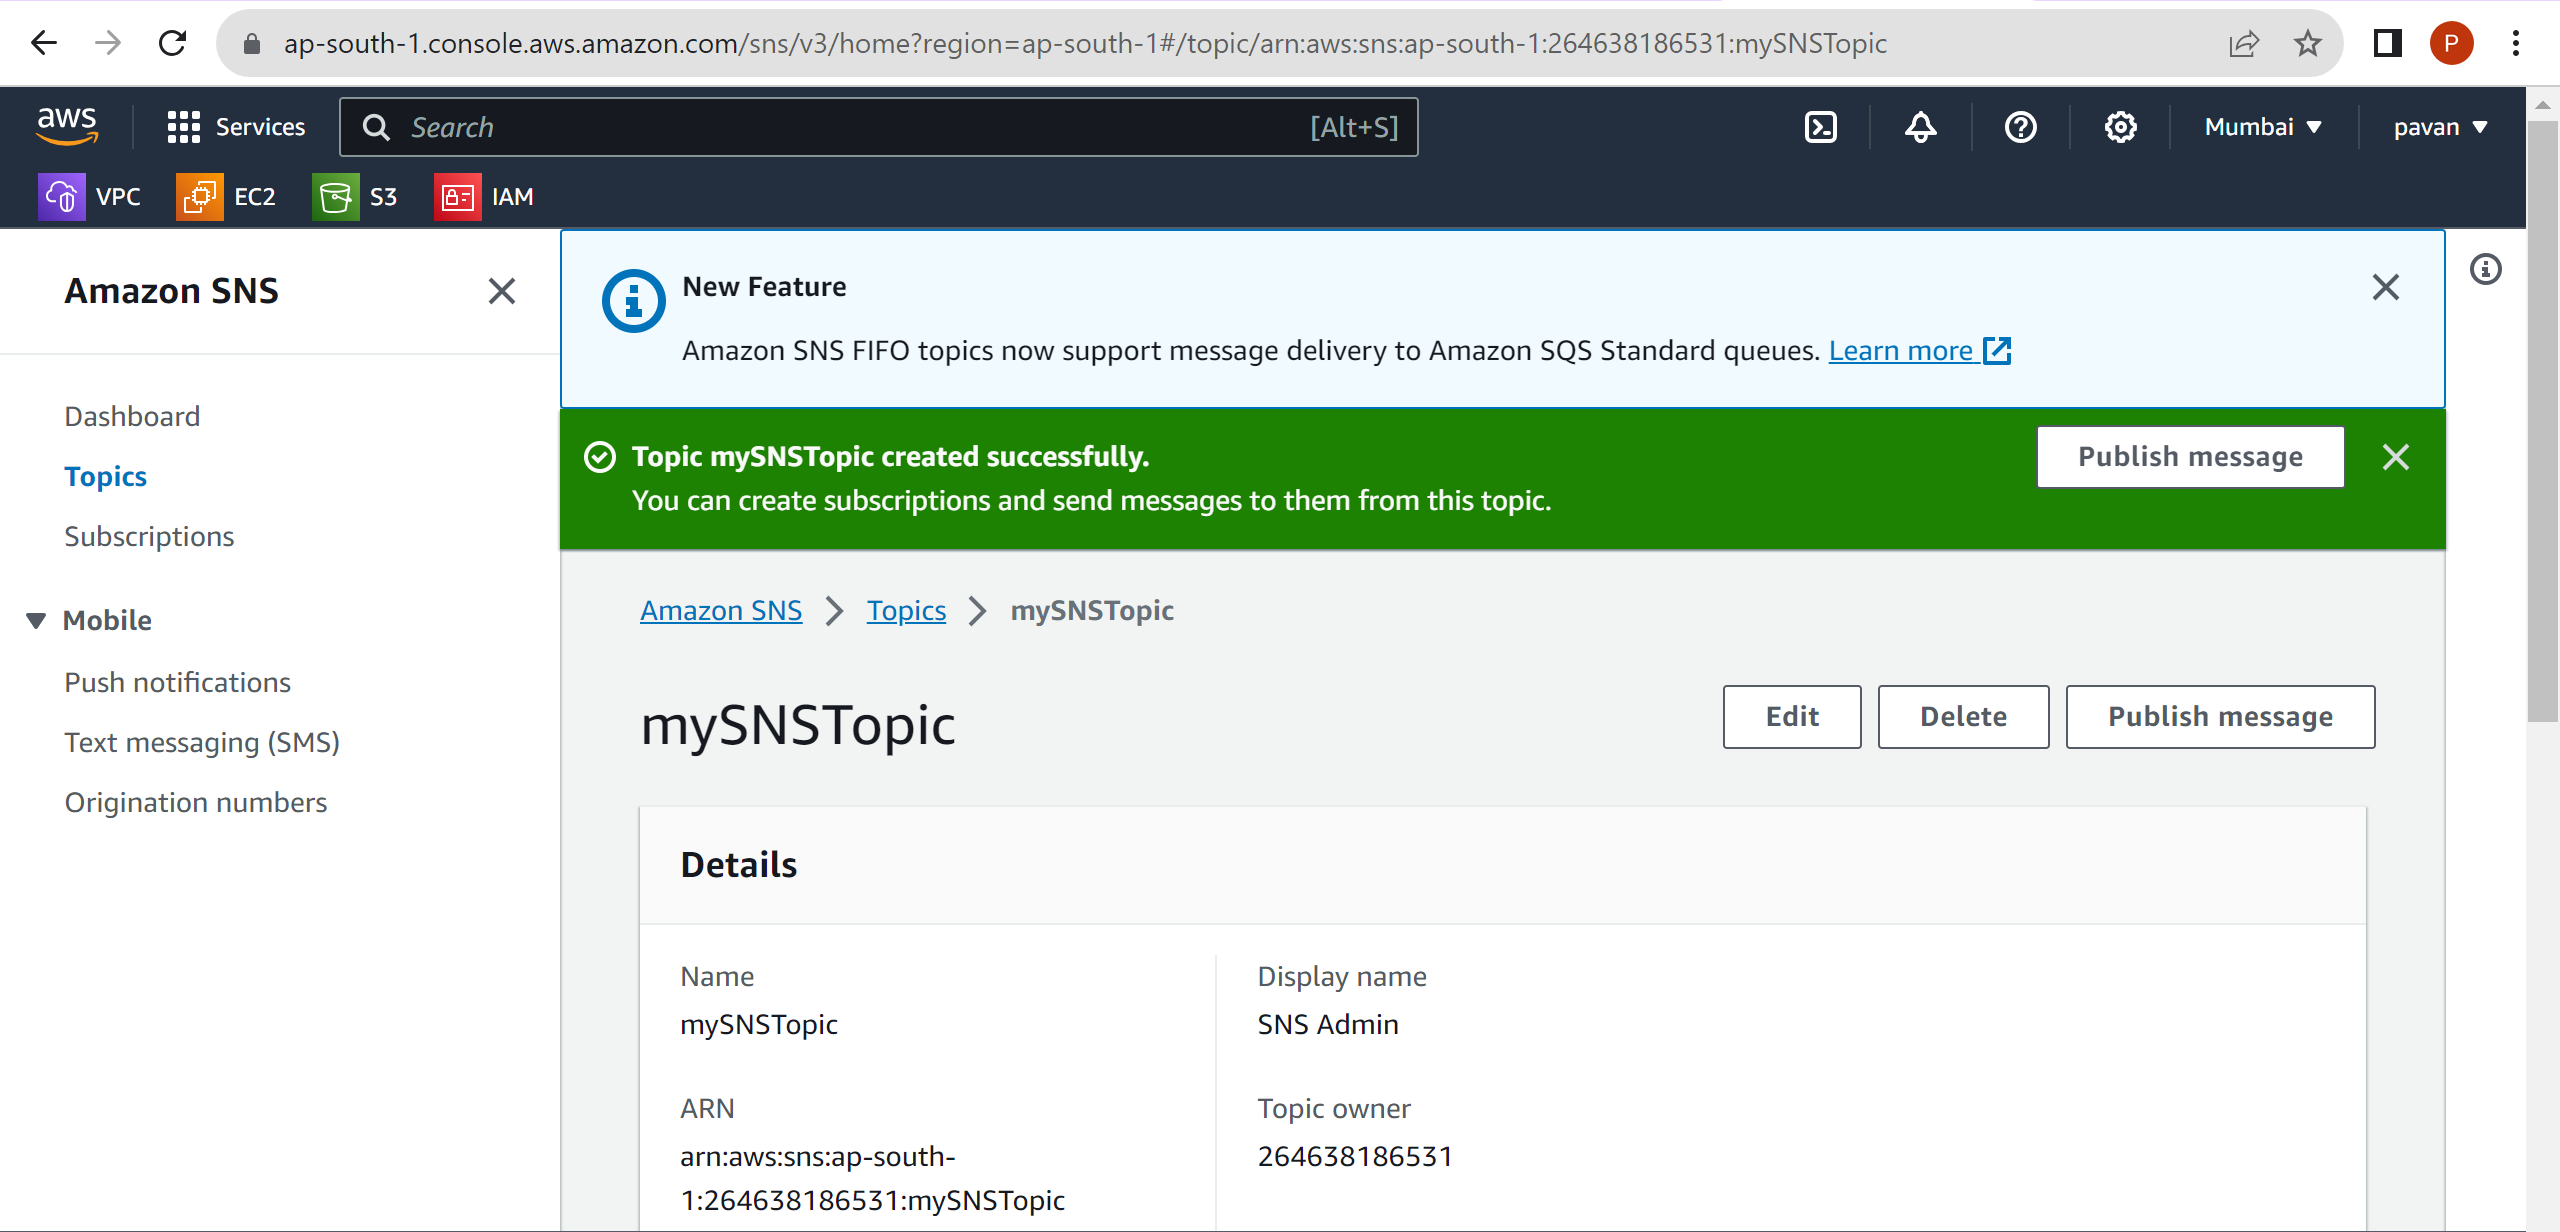
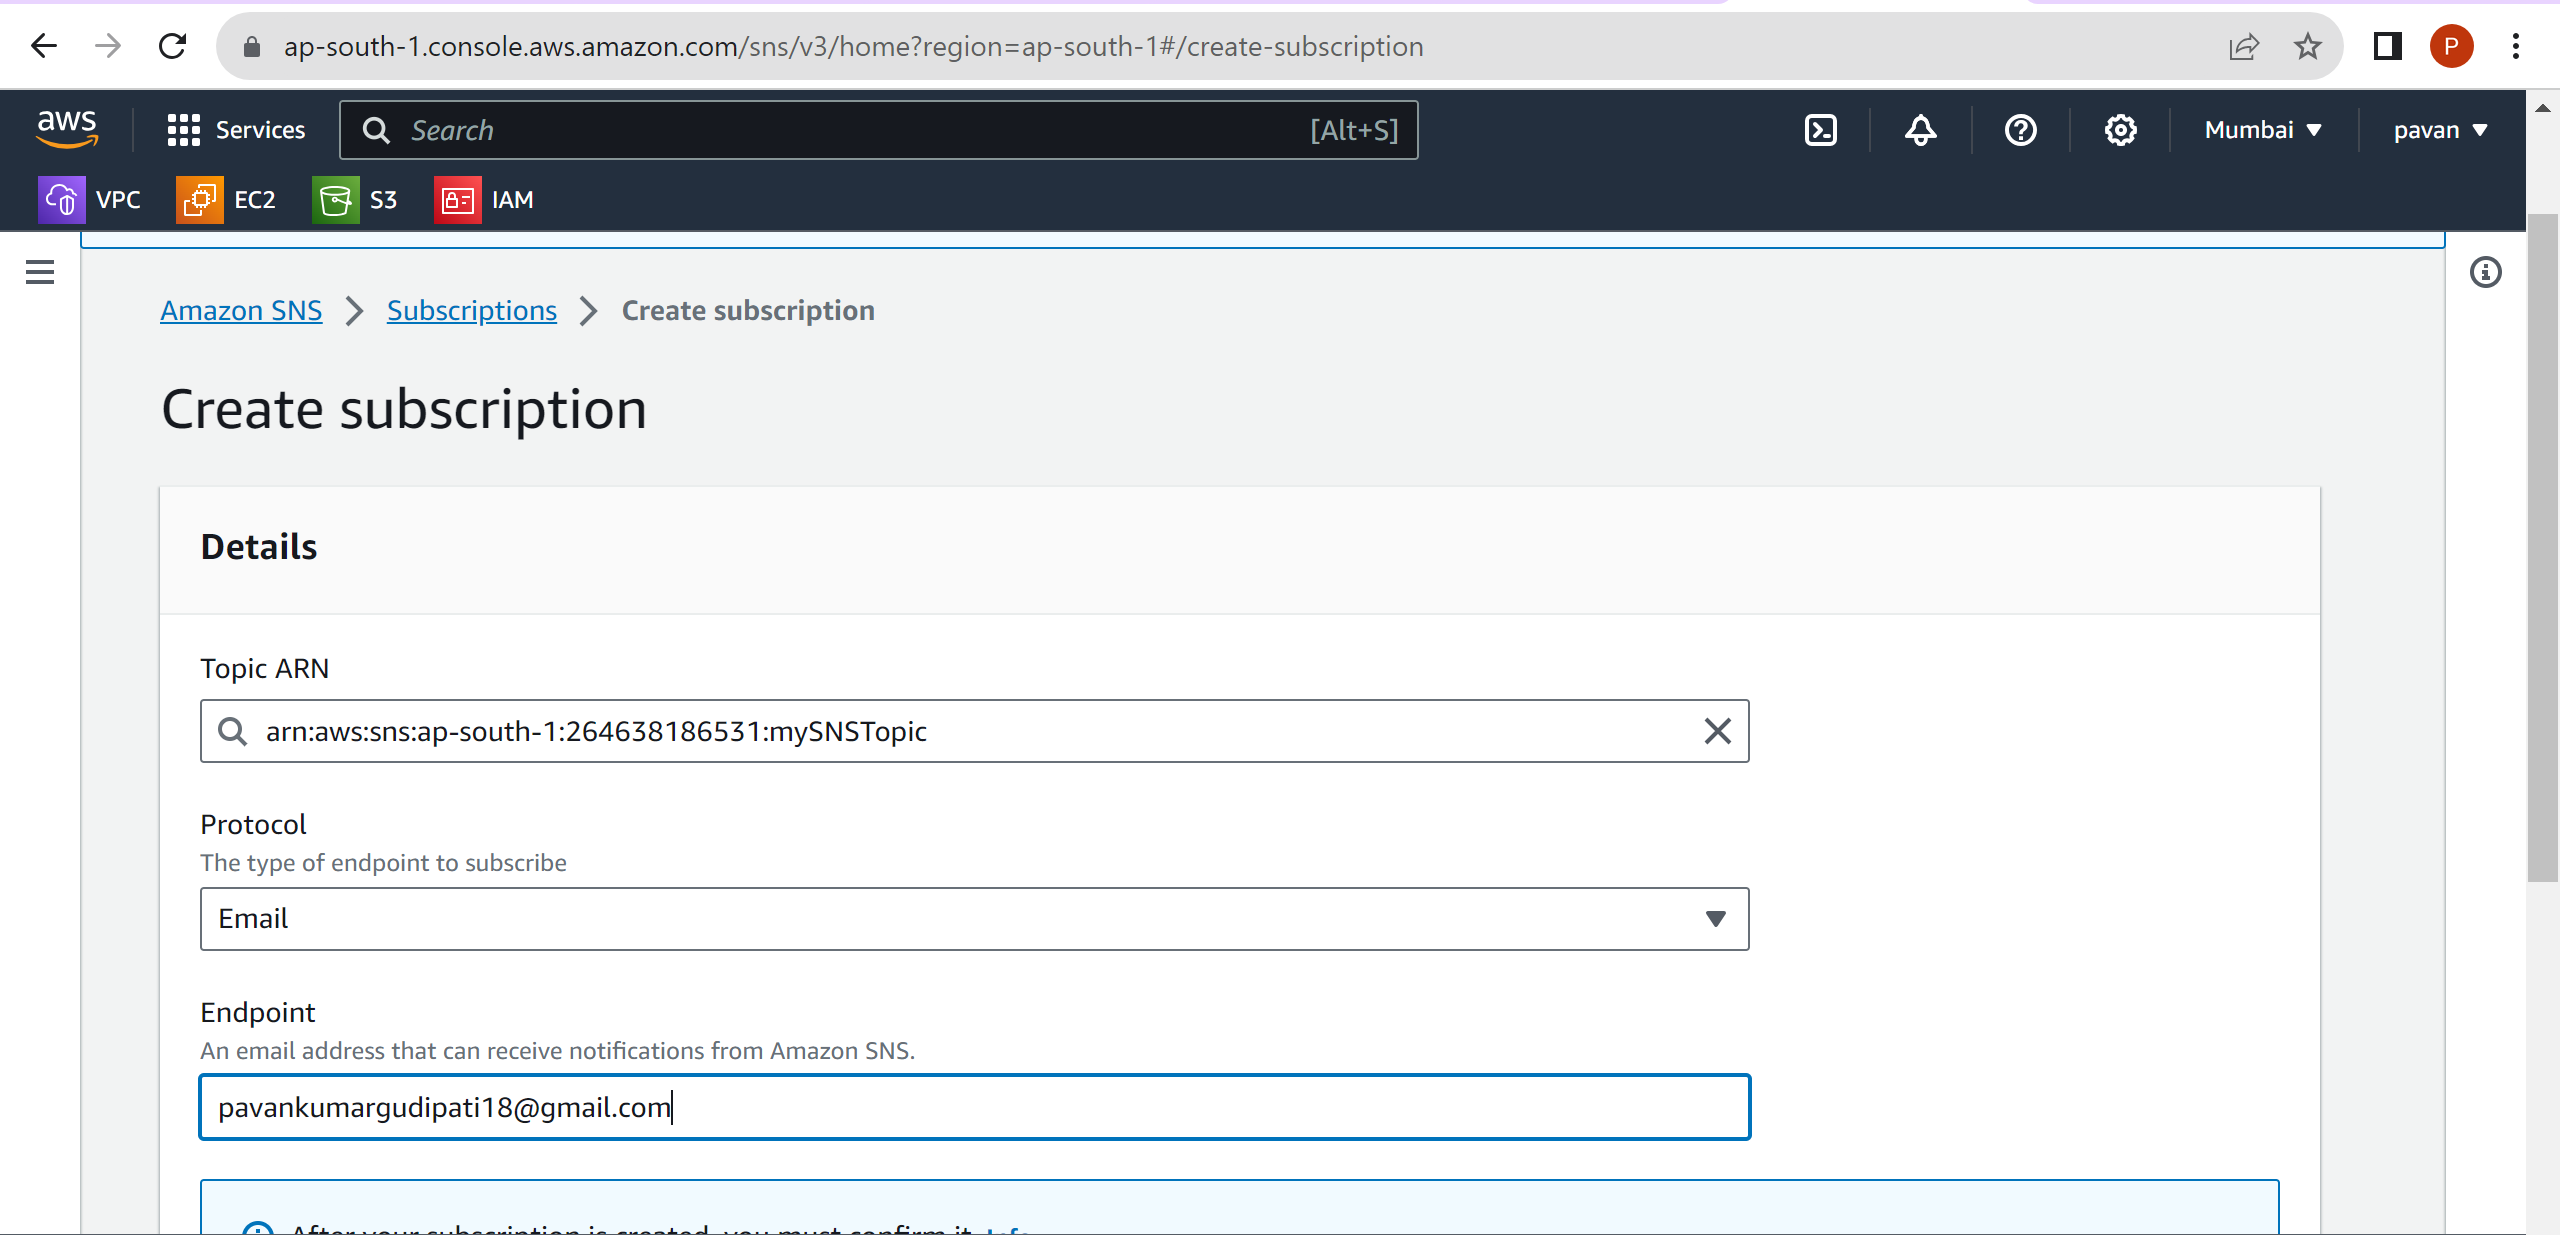
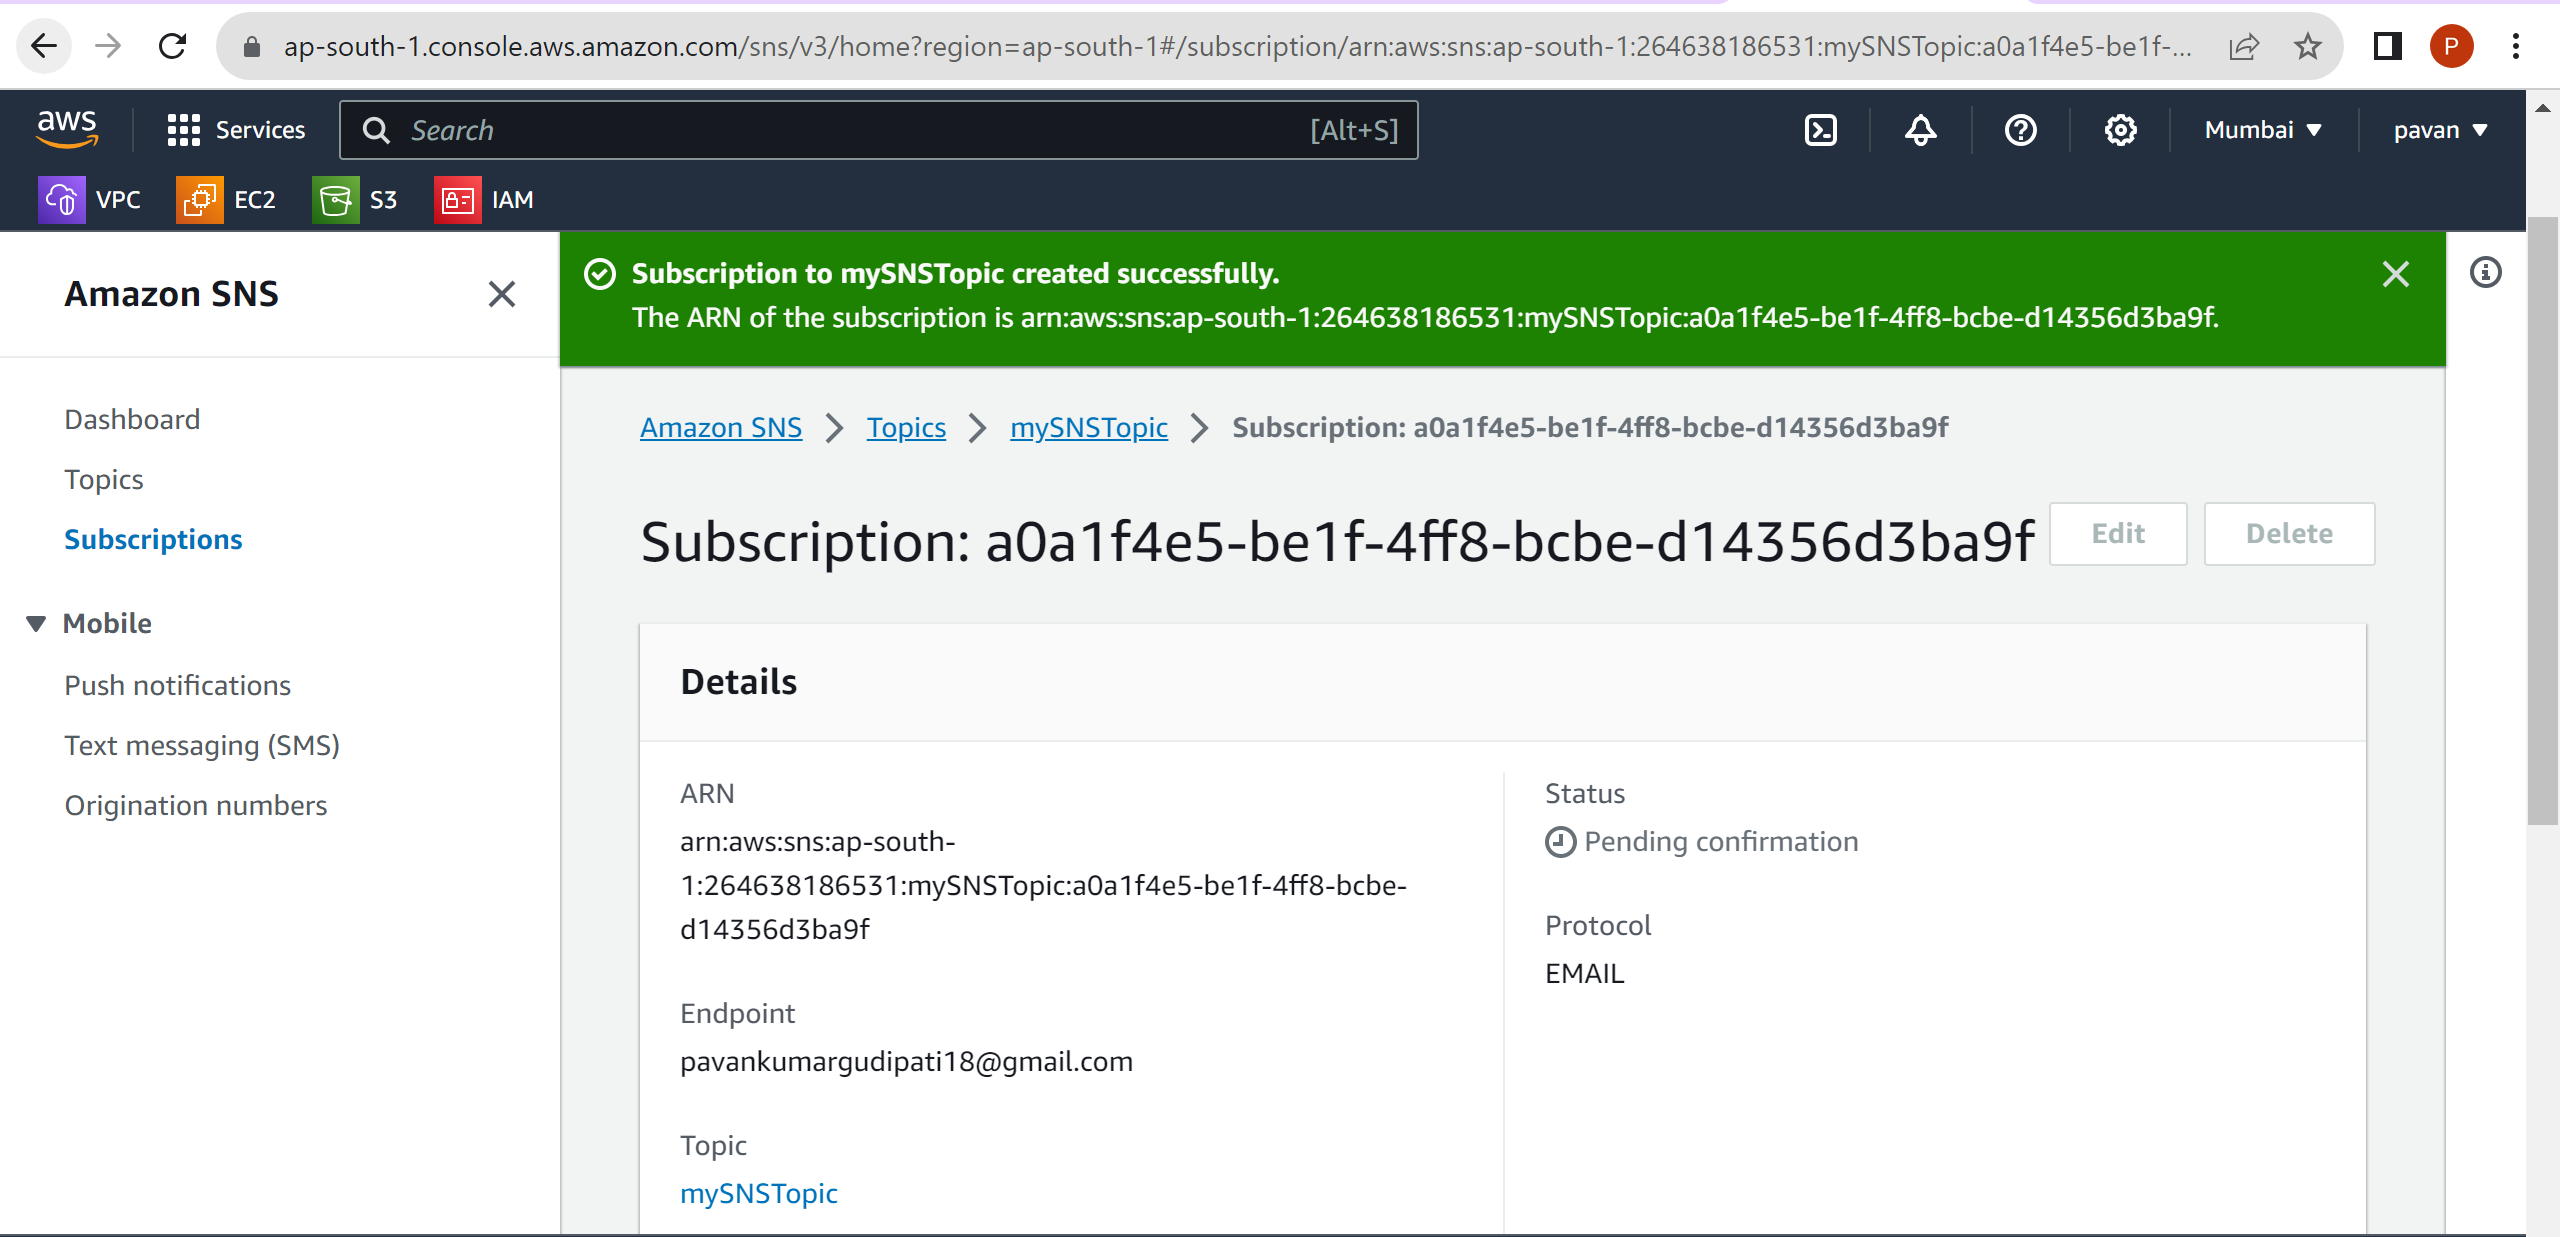
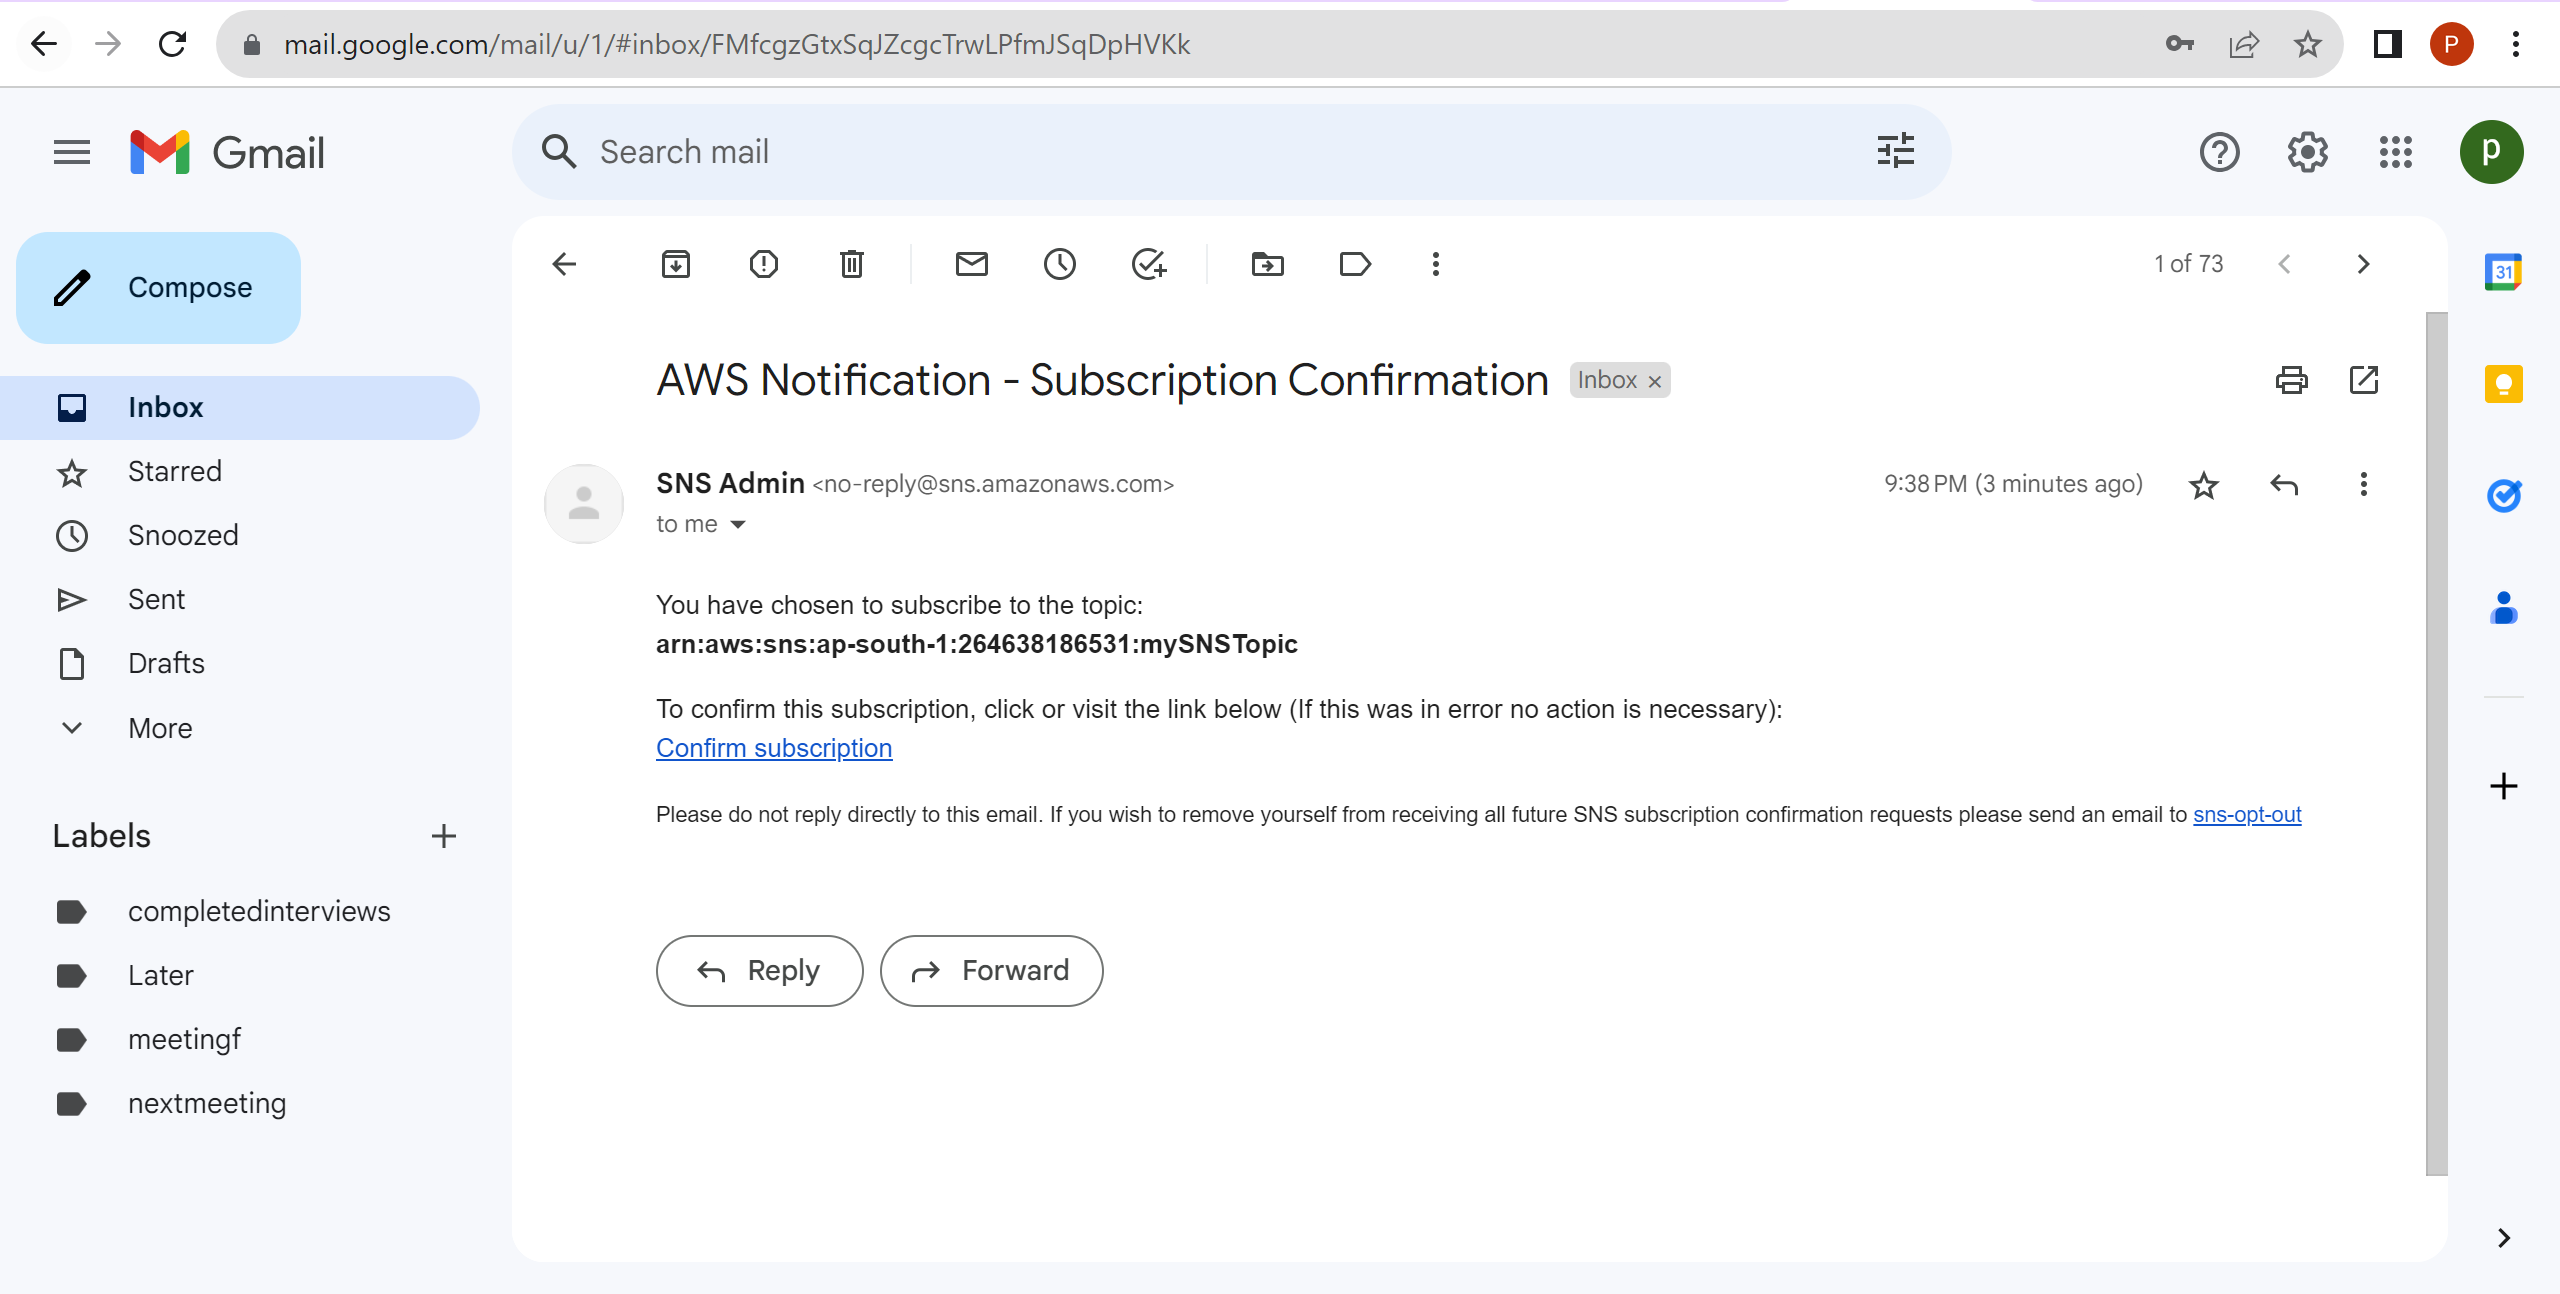
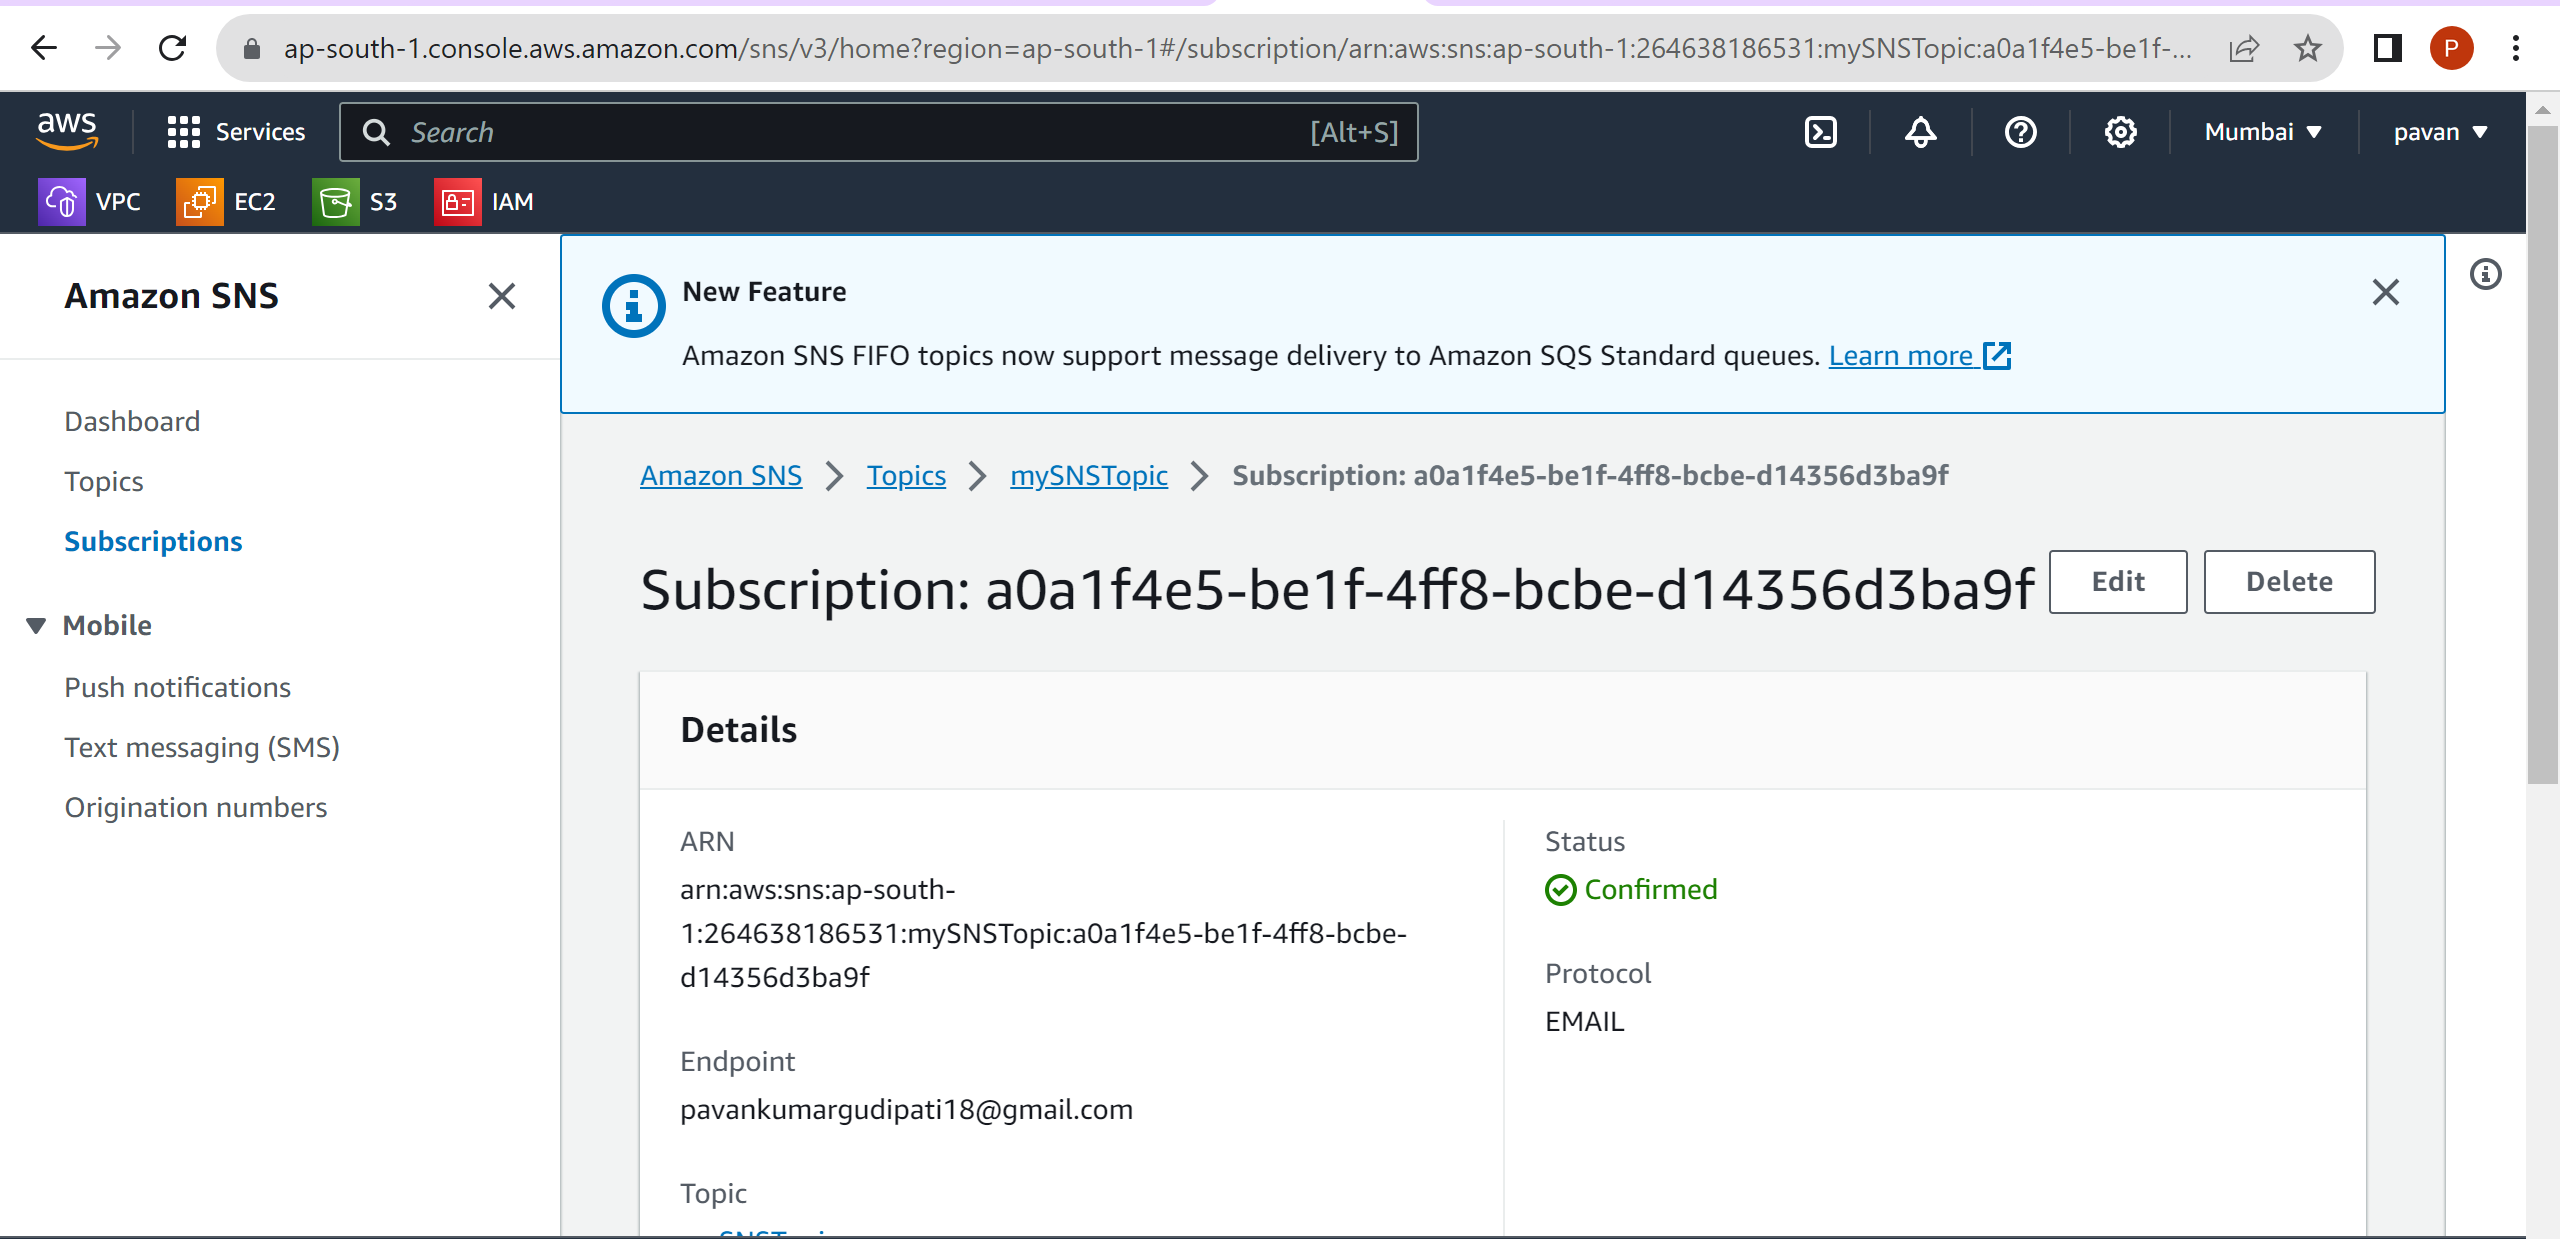
5. What is SNS? Create an SNS topic with your email as a subscriber.
Ans:
Amazon Simple Notification Service (Amazon SNS) is a fully managed messaging service provided by Amazon Web Services (AWS). It enables you to send messages or notifications to a distributed set of recipients through various communication protocols, including SMS text messages, email, application endpoints (e.g., AWS Lambda functions), and more. SNS makes it easy to build highly scalable, decoupled, and reliable applications that can send messages to a large number of subscribers or endpoints.


6. Create an EC2 alarm for CPU utilization. Install stress (ref 1) utility, increase CPU and make sure you get an alarm on your email.



7. Create an Autoscaling Group, and scale-in EC2 instances based on CPU utilisation. Increase CPU utilization on EC2 instances using stress utility.


8.What is AWS CloudTrial? Identify the sequence of events when an EC2 instance is created in CloudTrial.
Ans:
AWS CloudTrail is a service provided by Amazon Web Services (AWS) that enables you to monitor and log AWS account activity and actions taken within your AWS resources. It records detailed information about events and API calls made on your AWS infrastructure, creating a chronological record of these activities. This log data is valuable for security, compliance, troubleshooting, and operational analysis.


9.What are AWS FlowLogs? Enable VPC Flow Logs for an ENI and capture and analyze a VPC Flow log.
Ans:
AWS Flow Logs is a service provided by Amazon Web Services (AWS) that allows you to capture network traffic and create log records of that traffic for your AWS resources. Flow Logs provide detailed information about the traffic reaching and leaving network interfaces within your AWS Virtual Private Cloud (VPC), Subnets, or Network Security Groups (NSGs). This data can be used for various purposes, including network monitoring, troubleshooting, security analysis, and compliance.


10. Configure Cloudwatch log agent to push EC2 /var/log/messages.


